Time Line
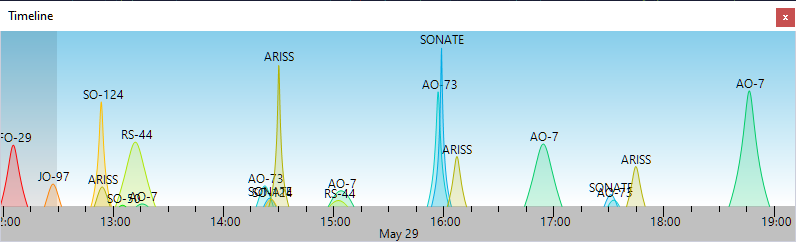
The TimeLine panel shows the satellite elevation chart as a function of time for all satellites in the selected group:
- Zoom in and out using the mouse wheel
- Pan by dragging the chart with your mouse
- Click on the satellite name to make it current, and to view the pass on the Sky View panel.
The dark part of the chart represents the past time.
The time scale is drawn in the time zone selected on the Clock widget. The date labels name the mode as (UTC) or (Local), and the marker in the top right corner of the panel shows Z or LT.